ENI keeps production under control

公司规模
Large Corporate
地区
- Europe
国家
- Italy
产品
- Qlik Sense
- Qlik GeoAnalytics
- New Flash
技术栈
- Data Visualization
- Geographical Data Analysis
实施规模
- Enterprise-wide Deployment
影响指标
- Productivity Improvements
- Digital Expertise
技术
- 应用基础设施与中间件 - 数据可视化
- 分析与建模 - 实时分析
适用行业
- 石油和天然气
用例
- 实时定位系统 (RTLS)
- 供应链可见性(SCV)
服务
- 数据科学服务
关于客户
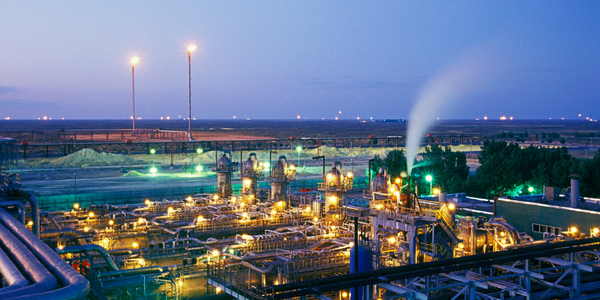
ENI is a multinational company involved in the extraction of natural gas and oil. The company owns more than 160 extraction plants located worldwide. These plants send performance and operations data on a daily basis. The equity of the company is equivalent to the value of the total average daily production of 1.8 million barrels of oil. The company's upstream activities are complex and require constant monitoring and management. The company's objective is to improve the timeliness, quality and granularity of the data from these plants for better managerial decision making.

挑战
ENI’s upstream activities are complex with more than 160 natural gas and oil extraction plants located worldwide sending performance and operations data on a daily basis. Keeping track of the overall situation is essential for managing maintenance operations and ensuring that the company reaches its targets. Without a dedicated platform, the data sent by the plants used to be collected via email and analyzed manually, using standard spreadsheets and occupying vast amounts of time and resources. Managers were only able to see an overview of production towards the end of the working day, via a PDF sent by email, with limited possibility for in-depth analysis. ENI needed to improve the control and analysis of this information, not so much for operations but for managerial purposes. The objective was to improve the timeliness, quality and granularity of the data, seeking to create a platform that provided a good customer experience and also enabled the analysis of historical data to allow managers to monitor performance more effectively.
解决方案
ENI, already a QlikView user, embarked on an extensive and demanding project to develop a dashboard in the form of a web application known internally as New Flash. The dashboard was intended for over 1,000 users, including workers, managers and senior company managers. The objective was to make it possible to easily and instantaneously consult the performance data provided by the sites, as well as analyze and compare targets and historical data. This led to the development of an integrated solution that provides, at a single glance, a complete progress overview of the resource extraction process and CO2 emissions worldwide, updated in near real-time. The data can be viewed by ‘field’ (the individual plant), ‘asset’ (a group of plants), or by geographical area. All of which is aggregated and subdivided into oil or gas. Making use of Qlik GeoAnalytics technology, ENI then added the option to locate assets on a map of the territory, using color-coding to quickly identify different situations at all plants.
运营影响
数量效益

Case Study missing?
Start adding your own!
Register with your work email and create a new case study profile for your business.
相关案例.

Case Study
Taking Oil and Gas Exploration to the Next Level
DownUnder GeoSolutions (DUG) wanted to increase computing performance by 5 to 10 times to improve seismic processing. The solution must build on current architecture software investments without sacrificing existing software and scale computing without scaling IT infrastructure costs.

Case Study
Remote Wellhead Monitoring
Each wellhead was equipped with various sensors and meters that needed to be monitored and controlled from a central HMI, often miles away from the assets in the field. Redundant solar and wind generators were installed at each wellhead to support the electrical needs of the pumpstations, temperature meters, cameras, and cellular modules. In addition to asset management and remote control capabilities, data logging for remote surveillance and alarm notifications was a key demand from the customer. Terra Ferma’s solution needed to be power efficient, reliable, and capable of supporting high-bandwidth data-feeds. They needed a multi-link cellular connection to a central server that sustained reliable and redundant monitoring and control of flow meters, temperature sensors, power supply, and event-logging; including video and image files. This open-standard network needed to interface with the existing SCADA and proprietary network management software.

Case Study
Refinery Saves Over $700,000 with Smart Wireless
One of the largest petroleum refineries in the world is equipped to refine various types of crude oil and manufacture various grades of fuel from motor gasoline to Aviation Turbine Fuel. Due to wear and tear, eight hydrogen valves in each refinery were leaking, and each cost $1800 per ton of hydrogen vented. The plant also had leakage on nearly 30 flare control hydrocarbon valves. The refinery wanted a continuous, online monitoring system that could catch leaks early, minimize hydrogen and hydrocarbon production losses, and improve safety for maintenance.