Comparing the Performance of Seasonal Fixtures
公司规模
1,000+
地区
- America
国家
- United States
产品
- RetailNext Analytics
技术栈
- Real-Time Analytics
- Data Visualization
- In-Store Data Collection
实施规模
- Departmental Deployment
影响指标
- Customer Satisfaction
- Productivity Improvements
- Revenue Growth
技术
- 分析与建模 - 实时分析
- 应用基础设施与中间件 - 数据可视化
- 功能应用 - 远程监控系统
适用行业
- 零售
适用功能
- 商业运营
- 销售与市场营销
用例
- 零售店自动化
服务
- 数据科学服务
- 系统集成
关于客户
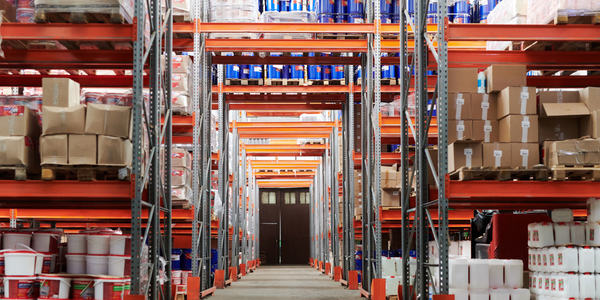
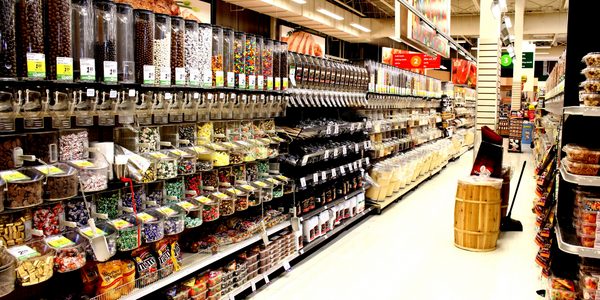
One of the nation’s fastest growing retailers, this small-format convenience and value retailer offers a compelling assortment of merchandise for the entire family. Products range from name brand food items to household cleaners, from health and beauty aids to toys, from apparel for every age to home fashions, all at everyday low prices.

挑战
The retailer wanted to understand performance differences between their front-end seasonal merchandisers (FESM) and seasonal end caps (SEC) vs. FESMs and SECs from a third-party display vendor.
解决方案
The retailer compared four sites featuring the vendor’s FESMs and SECs to a control group of three sites using the retailer’s own FESMs and SECs. To ensure a fair, “apples to apples” comparison, comprehensive metrics for each location were collected, including store-level traffic and conversion, display-level dwells and dwell conversion, as well as dwell times and sales. Data was collected over the same time period for each store location, spanning over four weeks between Thanksgiving and Christmas holidays.
运营影响
数量效益

Case Study missing?
Start adding your own!
Register with your work email and create a new case study profile for your business.
相关案例.

Case Study
Improving Production Line Efficiency with Ethernet Micro RTU Controller
Moxa was asked to provide a connectivity solution for one of the world's leading cosmetics companies. This multinational corporation, with retail presence in 130 countries, 23 global braches, and over 66,000 employees, sought to improve the efficiency of their production process by migrating from manual monitoring to an automatic productivity monitoring system. The production line was being monitored by ABB Real-TPI, a factory information system that offers data collection and analysis to improve plant efficiency. Due to software limitations, the customer needed an OPC server and a corresponding I/O solution to collect data from additional sensor devices for the Real-TPI system. The goal is to enable the factory information system to more thoroughly collect data from every corner of the production line. This will improve its ability to measure Overall Equipment Effectiveness (OEE) and translate into increased production efficiencies. System Requirements • Instant status updates while still consuming minimal bandwidth to relieve strain on limited factory networks • Interoperable with ABB Real-TPI • Small form factor appropriate for deployment where space is scarce • Remote software management and configuration to simplify operations
Case Study
How Sirqul’s IoT Platform is Crafting Carrefour’s New In-Store Experiences
Carrefour Taiwan’s goal is to be completely digital by end of 2018. Out-dated manual methods for analysis and assumptions limited Carrefour’s ability to change the customer experience and were void of real-time decision-making capabilities. Rather than relying solely on sales data, assumptions, and disparate systems, Carrefour Taiwan’s CEO led an initiative to find a connected IoT solution that could give the team the ability to make real-time changes and more informed decisions. Prior to implementing, Carrefour struggled to address their conversion rates and did not have the proper insights into the customer decision-making process nor how to make an immediate impact without losing customer confidence.

Case Study
Digital Retail Security Solutions
Sennco wanted to help its retail customers increase sales and profits by developing an innovative alarm system as opposed to conventional connected alarms that are permanently tethered to display products. These traditional security systems were cumbersome and intrusive to the customer shopping experience. Additionally, they provided no useful data or analytics.

Case Study
Ensures Cold Milk in Your Supermarket
As of 2014, AK-Centralen has over 1,500 Danish supermarkets equipped, and utilizes 16 operators, and is open 24 hours a day, 365 days a year. AK-Centralen needed the ability to monitor the cooling alarms from around the country, 24 hours a day, 365 days a year. Each and every time the door to a milk cooler or a freezer does not close properly, an alarm goes off on a computer screen in a control building in southwestern Odense. This type of alarm will go off approximately 140,000 times per year, equating to roughly 400 alarms in a 24-hour period. Should an alarm go off, then there is only a limited amount of time to act before dairy products or frozen pizza must be disposed of, and this type of waste can quickly start to cost a supermarket a great deal of money.

Case Study
Supermarket Energy Savings
The client had previously deployed a one-meter-per-store monitoring program. Given the manner in which energy consumption changes with external temperature, hour of the day, day of week and month of year, a single meter solution lacked the ability to detect the difference between a true problem and a changing store environment. Most importantly, a single meter solution could never identify root cause of energy consumption changes. This approach never reduced the number of truck-rolls or man-hours required to find and resolve issues.
