Tableau’s Visualizations Reveal Critical Trends in Real-Time
公司规模
1,000+
地区
- America
国家
- United States
产品
- Tableau
技术栈
- MySQL
实施规模
- Enterprise-wide Deployment
影响指标
- Digital Expertise
- Productivity Improvements
技术
- 应用基础设施与中间件 - 数据可视化
适用行业
- 汽车
- 零售
适用功能
- 商业运营
- 销售与市场营销
用例
- 库存管理
- 实时定位系统 (RTLS)
服务
- 数据科学服务
关于客户
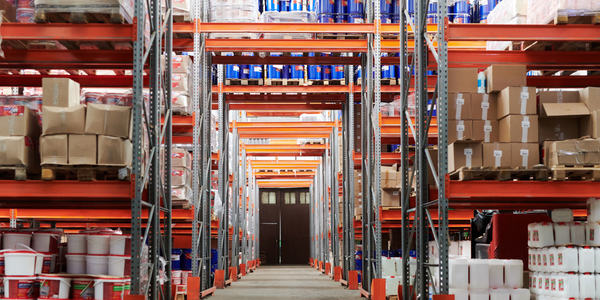
US Auto Parts is a leading Internet retailer of aftermarket auto parts. The company sells over 700,000 SKUs across 4,000+ auto part categories through a network of websites, e-bay, and a call center. They leverage a vendor network in addition to stocking inventory in their two warehouses. They also sell direct to distributors and local body shops in the Los Angeles area. The company needed a flexible and fast reporting and analysis tool that could be managed by the analytics team, with limited IT involvement.

挑战
US Auto Parts, a leading Internet retailer of aftermarket auto parts, was facing challenges in analyzing their sales across the various dimensions of their business. The process was tedious and sometimes overwhelming. They relied heavily on their IT department to build reports—a process that was neither flexible nor fast. They needed a reporting and analysis tool that could be managed by the analytics team, with limited IT involvement. The tool also needed to empower business units to do their own analysis.
解决方案
US Auto Parts adopted Tableau as their primary tool for reporting. They use MySQL to house its sales data, and have begun integrating online customer behavior and market research data from their web analytics and research tools to greater leverage Tableau in bringing these different measures together in a single source for all to access. Tableau’s visualizations have changed how the company operates by giving people the information they need to understand and react to trends in real-time. When US Auto Parts analyzes its performance, it makes use of the interactive functionality Tableau offers. Category managers can filter by time period, sales channel, or website, and interactively drill into category results by product subcategories, parts, SKUs, and SKU application.
运营影响

Case Study missing?
Start adding your own!
Register with your work email and create a new case study profile for your business.
相关案例.

Case Study
Integral Plant Maintenance
Mercedes-Benz and his partner GAZ chose Siemens to be its maintenance partner at a new engine plant in Yaroslavl, Russia. The new plant offers a capacity to manufacture diesel engines for the Russian market, for locally produced Sprinter Classic. In addition to engines for the local market, the Yaroslavl plant will also produce spare parts. Mercedes-Benz Russia and his partner needed a service partner in order to ensure the operation of these lines in a maintenance partnership arrangement. The challenges included coordinating the entire maintenance management operation, in particular inspections, corrective and predictive maintenance activities, and the optimizing spare parts management. Siemens developed a customized maintenance solution that includes all electronic and mechanical maintenance activities (Integral Plant Maintenance).


Case Study
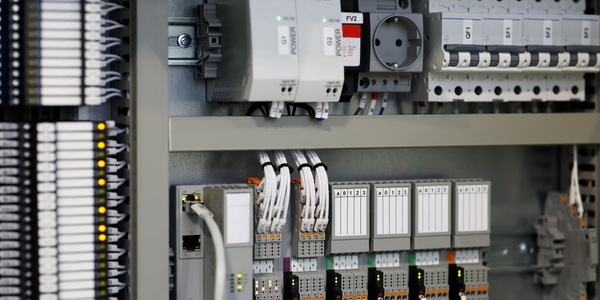
Improving Production Line Efficiency with Ethernet Micro RTU Controller
Moxa was asked to provide a connectivity solution for one of the world's leading cosmetics companies. This multinational corporation, with retail presence in 130 countries, 23 global braches, and over 66,000 employees, sought to improve the efficiency of their production process by migrating from manual monitoring to an automatic productivity monitoring system. The production line was being monitored by ABB Real-TPI, a factory information system that offers data collection and analysis to improve plant efficiency. Due to software limitations, the customer needed an OPC server and a corresponding I/O solution to collect data from additional sensor devices for the Real-TPI system. The goal is to enable the factory information system to more thoroughly collect data from every corner of the production line. This will improve its ability to measure Overall Equipment Effectiveness (OEE) and translate into increased production efficiencies. System Requirements • Instant status updates while still consuming minimal bandwidth to relieve strain on limited factory networks • Interoperable with ABB Real-TPI • Small form factor appropriate for deployment where space is scarce • Remote software management and configuration to simplify operations