Streamlining Pavement Project Reviews Through Visualization
公司规模
Large Corporate
地区
- America
国家
- United States
产品
- AgileAssets® Pavement Analyst™
- H-Chart Visualization Tool
技术栈
- Data Visualization
- Pavement Management System
实施规模
- Enterprise-wide Deployment
影响指标
- Productivity Improvements
- Cost Savings
技术
- 应用基础设施与中间件 - 数据可视化
- 应用基础设施与中间件 - 数据库管理和存储
适用行业
- 建筑与基础设施
适用功能
- 维护
- 物流运输
用例
- 基础设施检查
- 施工管理
服务
- 系统集成
- 软件设计与工程服务
关于客户
The California Department of Transportation (Caltrans) is a government agency that manages one of the largest state-owned road networks in the U.S., including more than 50,000 lane miles of roads and 13,063 state highway bridges. Caltrans also permits more than 400 public-use airports and special-use heliports, provides inter-city rail services, and owns or controls 350,000 acres of right-of-way. The agency is responsible for the construction, maintenance, and operation of the California state highway system, as well as that of the related transportation facilities within the state. Caltrans' mission is to provide a safe, sustainable, integrated, and efficient transportation system to enhance California's economy and livability.

挑战
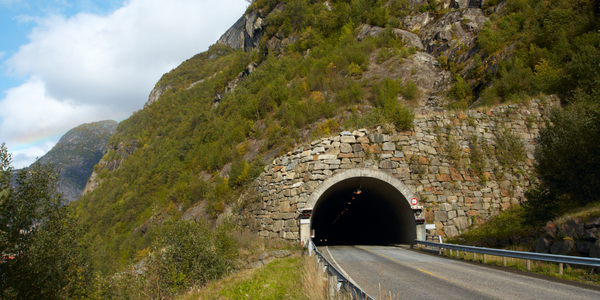
The California Department of Transportation (Caltrans) manages one of the largest state-owned road networks in the U.S., including more than 50,000 lane miles of roads and 13,063 state highway bridges. The agency wanted to implement a visualization tool within its deployment of AgileAssets® Pavement Analyst™, an advanced pavement management system (PMS) known internally at Caltrans as PaveM. The tool would facilitate the pavement project review process by displaying the relationships between the recommended projects and the currently programmed, under-construction, and as-built projects. Caltrans faced several challenges in developing and implementing the H-Chart project visualization tool. It needed to manage external development of H-Chart with the UCPRC, ensure the tool met specific requirements, and integrate the tool successfully with its PMS to access data for visualization and evaluation.
解决方案
Caltrans partnered with the University of California Pavement Research Center (UCPRC) to develop an automated visualization tool called H-Chart, short for Highway Chart. The tool was designed to be automated, efficient, and highly functional, capable of processing large sets of pavement data and facilitating calibration, validation, and further improvement of Caltrans’ PMS. With advanced analytical capabilities in place via PaveM, Caltrans used Pavement Analyst to provide pavement data to the H-Chart visualization tool. Key aspects of the H-Chart implementation included integrating Pavement Analyst with H-Chart, configuring Pavement Analyst to provide pavement data to H-Chart, and configuring H-Chart to efficiently process and visually map large sets of pavement data.
运营影响

Case Study missing?
Start adding your own!
Register with your work email and create a new case study profile for your business.
相关案例.
Case Study
IoT System for Tunnel Construction
The Zenitaka Corporation ('Zenitaka') has two major business areas: its architectural business focuses on structures such as government buildings, office buildings, and commercial facilities, while its civil engineering business is targeted at structures such as tunnels, bridges and dams. Within these areas, there presented two issues that have always persisted in regard to the construction of mountain tunnels. These issues are 'improving safety" and "reducing energy consumption". Mountain tunnels construction requires a massive amount of electricity. This is because there are many kinds of electrical equipment being used day and night, including construction machinery, construction lighting, and ventilating fan. Despite this, the amount of power consumption is generally not tightly managed. In many cases, the exact amount of power consumption is only ascertained when the bill from the power company becomes available. Sometimes, corporations install demand-monitoring equipment to help curb the maximum power demanded. However, even in these cases, the devices only allow the total volume of power consumption to be ascertained, or they may issue warnings to prevent the contracted volume of power from being exceeded. In order to tackle the issue of reducing power consumption, it was first necessary to obtain an accurate breakdown of how much power was being used in each particular area. In other words, we needed to be able to visualize the amount of power being consumed. Safety, was also not being managed very rigorously. Even now, tunnel construction sites often use a 'name label' system for managing entry into the work site. Specifically, red labels with white reverse sides that bear the workers' names on both sides are displayed at the tunnel work site entrance. The workers themselves then flip the name label to the appropriate side when entering or exiting from the work site to indicate whether or not they are working inside the tunnel at any given time. If a worker forgets to flip his or her name label when entering or exiting from the tunnel, management cannot be performed effectively. In order to tackle the challenges mentioned above, Zenitaka decided to build a system that could improve the safety of tunnel construction as well as reduce the amount of power consumed. In other words, this new system would facilitate a clear picture of which workers were working in each location at the mountain tunnel construction site, as well as which processes were being carried out at those respective locations at any given time. The system would maintain the safety of all workers while also carefully controlling the electrical equipment to reduce unnecessary power consumption. Having decided on the concept, our next concern was whether there existed any kind of robust hardware that would not break down at the construction work site, that could move freely in response to changes in the working environment, and that could accurately detect workers and vehicles using radio frequency identification (RFID). Given that this system would involve many components that were new to Zenitaka, we decided to enlist the cooperation of E.I.Sol Co., Ltd. ('E.I.Sol') as our joint development partner, as they had provided us with a highly practical proposal.

Case Study
Splunk Partnership Ties Together Big Data & IoT Services
Splunk was faced with the need to meet emerging customer demands for interfacing IoT projects to its suite of services. The company required an IoT partner that would be able to easily and quickly integrate with its Splunk Enterprise platform, rather than allocating development resources and time to building out an IoT interface and application platform.

Case Study
Bridge monitoring in Hamburg Port
Kattwyk Bridge is used for both rail and road transport, and it has played an important role in the Port of Hamburg since 1973. However, the increasing pressure from traffic requires a monitoring solution. The goal of the project is to assess in real-time the bridge's status and dynamic responses to traffic and lift processes.

Case Study
Bellas Landscaping
Leading landscaping firm serving central Illinois streamlines operations with Samsara’s real-time fleet tracking solution: • 30+ vehicle fleet includes International Terrastar dump trucks and flatbeds, medium- and light-duty pickups from Ford and Chevrolet. Winter fleet includes of snow plows and salters.

Case Study
Condition Based Monitoring for Industrial Systems
A large construction aggregate plant operates 10 high horsepower Secondary Crusher Drive Motors and associated conveyor belts, producing 600 tons of product per hour. All heavy equipment requires maintenance, but the aggregate producer’s costs were greatly magnified any time that the necessary maintenance was unplanned and unscheduled. The product must be supplied to the customers on a tight time schedule to fulfill contracts, avoid penalties, and prevent the loss of future business. Furthermore, a sudden failure in one of the drive motors would cause rock to pile up in unwanted locations, extending the downtime and increasing the costs.Clearly, preventative maintenance was preferable to unexpected failures. So, twice each year, the company brought in an outside vendor to attach sensors to the motors, do vibration studies, measure bearing temperatures and attempt to assess the health of the motors. But that wasn’t enough. Unexpected breakdowns continued to occur. The aggregate producer decided to upgrade to a Condition Based Monitoring (CBM) sensor system that could continually monitor the motors in real time, apply data analytics to detect changes in motor behavior before they developed into major problems, and alert maintenance staff via email or text, anywhere they happened to be.A wired sensor network would have been cost prohibitive. An aggregate plant has numerous heavy vehicles moving around, so any cabling would have to be protected. But the plant covers 400 acres, and the cable would have to be trenched to numerous locations. Cable wasn’t going to work. The aggregate producer needed a wireless solution.
