Mapping Segregation: MIT’s Atlas of Inequality

Technology Category
- Analytics & Modeling - Machine Learning
- Sensors - Lidar & Lazer Scanners
Applicable Industries
- Cities & Municipalities
- Retail
Applicable Functions
- Logistics & Transportation
Use Cases
- Smart City Operations
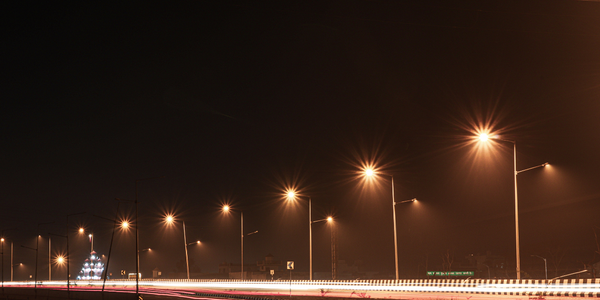
- Smart Lighting
About The Customer
The customer in this case study is the general public, particularly those living in urban areas. The Atlas of Inequality is a tool that can be used by anyone interested in understanding the dynamics of social segregation in cities. It can be particularly useful for urban planners, policymakers, and social scientists who are interested in addressing issues of inequality and segregation. The tool can also be used by businesses to understand the demographics of the areas they operate in and make informed decisions about where to open new locations.

The Challenge
The challenge revolves around understanding the social segregation in cities, particularly in the United States. The traditional understanding of segregation is based on geographical locations, often characterized by the stark contrast between rich and poor areas within close proximity. However, this perspective fails to consider the 'why' behind segregation, focusing solely on the 'where'. The challenge is to challenge this traditional notion of segregation by using high-frequency location data to understand the reasons behind segregation. The data gathered from 11 of the most populated metropolitan areas in the US revealed that on average, around 75% of the people we interact with daily live more than 15 kilometers away. This suggests that to understand segregation, we need to go beyond geographical locations and start considering the reasons behind it.
The Solution
The solution to this challenge was the development of the Atlas of Inequality, an online tool that maps 1.2 million points of interest in cities, such as restaurants, universities, etc. Each point is colored according to the inequality of the place, which is determined by how uneven the distribution of incomes of the people visiting that place is. The Atlas of Inequality provides a more nuanced understanding of segregation, showing that it is not just about where people live, but also about the places they visit and the choices they make. For instance, the type of food people prefer can influence the segregation they experience, with Latin American and fast-food restaurants being the most segregated. The Atlas also revealed that the opening of a single business can impact inequality in an area. For example, the opening of Eataly, a restaurant in the Prudential Center in Boston, decreased the total segregation of the area by 10%.
Operational Impact
Quantitative Benefit

Case Study missing?
Start adding your own!
Register with your work email and create a new case study profile for your business.
Related Case Studies.

Case Study
Turning A Stadium Into A Smart Building
Honeywell created what it called the “intelligent system” for the National Stadium in Beijing, China, turning the venue for the opening and closing events at the 2008 Summer Olympics into a “smart building.” Designed by highly controversial artist Ai Weiwei, the “Bird’s Nest” remains one of the most impressive feats of stadium architecture in the world. The 250,000 square meter structure housed more than 100,000 athletes and spectators at a time. To accommodate such capacity, China turned to Honeywell’s EBI Integrated Building Management System to create an integrated “intelligent system” for improved building security, safety and energy efficiency.
.png)
Case Study
Smart Street Light Network (Copenhagen)
Key stakeholders are taking a comprehensive approach to rethinking smart city innovation. City leaders have collaborated through partnerships involving government, research institutions and solution providers. The Copenhagen Solutions Lab is one of the leading organizations at the forefront of this movement. By bringing together manufacturers with municipal buyers, the Copenhagen Solutions Lab has catalyzed the development and deployment of next-generation smart city innovations. Copenhagen is leveraging this unique approach to accelerate the implementation of smart city solutions. One of the primary focus areas is LED street lighting.

Case Study
Buoy Status Monitoring with LoRa
The Netherlands are well-known for their inland waterways, canals, sluices and of course port activities. The Dutch Ministry of Infrastructure indicates that there are thousands of buoys and fixed items in and near water environments that would profit from IoT monitoring. One of the problems with buoys for example, is that they get hit by ships and the anchor cable breaks. Without connectivity, it takes quite some time to find out that something has happened with that buoy. Not to mention the costs of renting a boat to go to the buoy to fix it. Another important issue, is that there is no real-time monitoring of the buoys at this moment. Only by physically visiting the object on the water, one gains insight in its status.
Case Study
China Mobile Smart Parking
Smart Parking, powered by NB-IoT technology, is making it easier for drivers to find free parking spots. Cities can better manage their parking assets and maximize the revenue available to them as a result. Drivers searching for parking create congestion and pollution by circling and hunting for available parking. Smart Parking services are able to significantly ease these problems by guiding a driver directly to a parking space.

Case Study
Barcelona Case Study
Barcelona’s heavy traffic and its associated high levels of pollution were the primary factors that motivated some companies and universities to work on strategies for improving traffic in the city centre. Bitcarrier is one of the technologies involved in the In4Mo Project, whose main objective is to develop the applications that form the core of smart mobility, one of the fundamental pillars of the smart city concept.
